Wildfire News
‹ All PostsAugust 2026: Fifteen Fires. More Than Two Million Hectares.
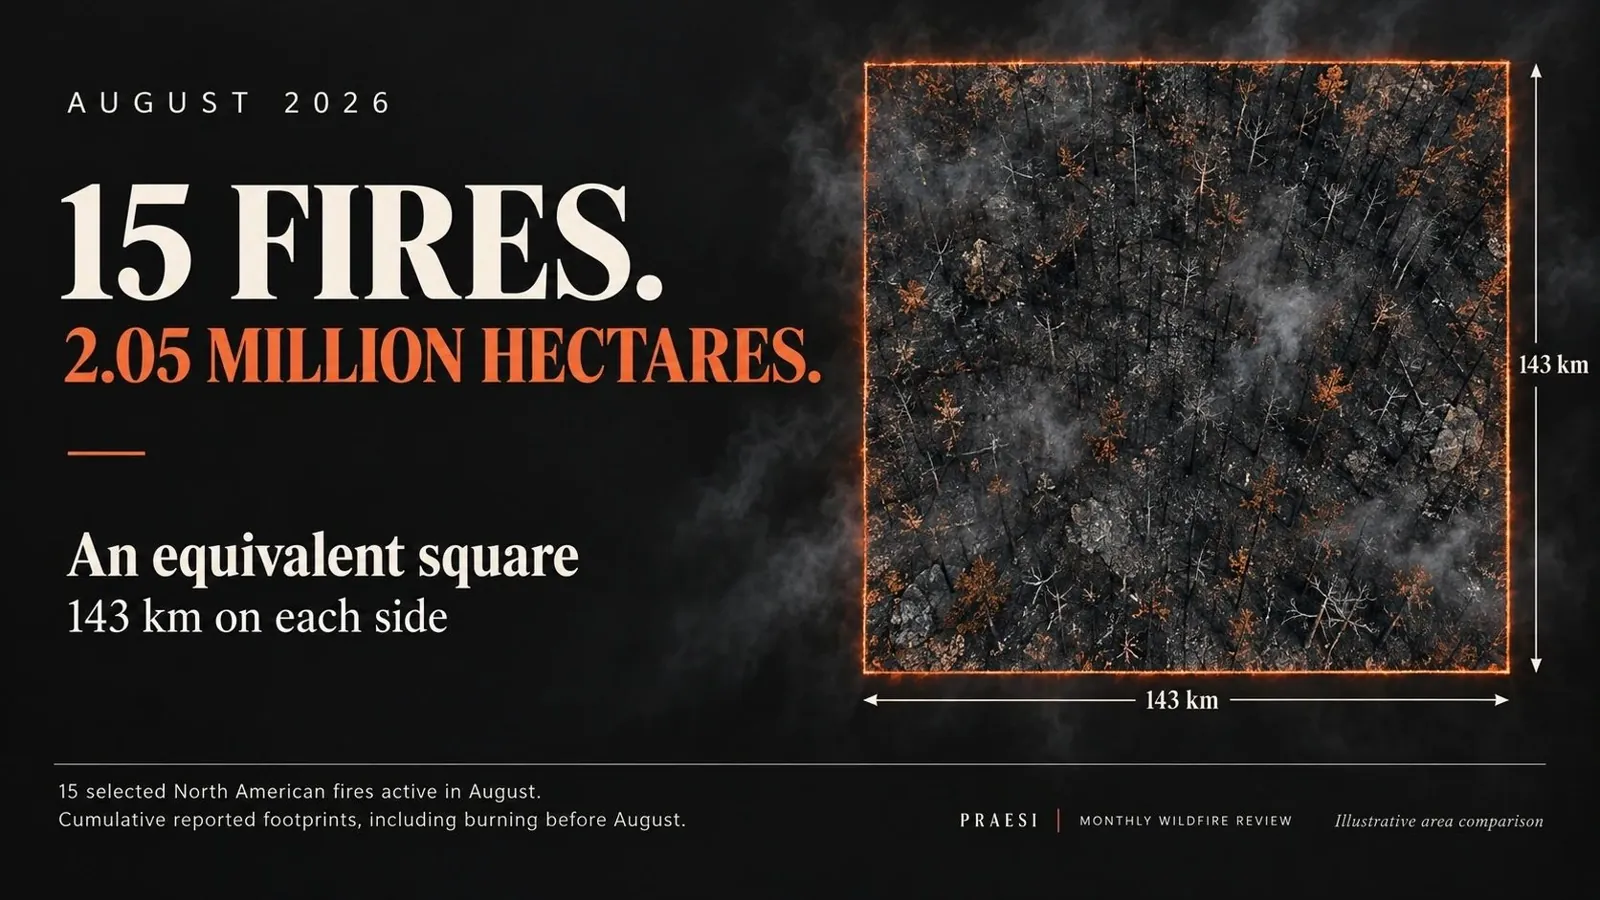
Imagine a square 143 kilometres wide and 143 kilometres long. Stand at one corner and the opposite edge is roughly the distance of a long intercity journey away.
That is the combined reported footprint of 15 major North American wildfires and fire complexes active during August 2026 reviewed here: approximately 2.05 million hectares, or 20,450 square kilometres.
Fifteen incidents. One enormous measure of the pressure carried through the month.
These are cumulative incident areas reported during August, including land burned before the month began. They are not an estimate of land newly burned in August, and this selection is not a complete global ranking. The wider monthly picture extends from Canada’s boreal forests and the western United States to northern Russia, Europe and Indonesia.
The month changed. The fires did not reset.
A monthly retrospective has a problem that an individual fire report does not: the calendar draws a clean boundary, while a fire keeps moving.
Several of the incidents in this review had already been burning before August. By late summer, their story involved more than additional hectares. It included continued monitoring, holding established lines, dealing with residual heat and managing the long transition towards recovery.
Ontario’s Thunder Bay 36 illustrates that persistence. An update covering 30 August put it at 301,240 hectares. It was being managed within the Rinker Lake Complex alongside two other fires. The report described low activity but continued work on hotspots. The enormous footprint remained even as the immediate pace eased. Ontario regional update, republished by Wawa News
In the Northwest Territories, ZF018-26 was reported at 297,400 hectares on 23 August. The territory described it as a lightning-caused fire first detected in June and being monitored, with no threatened communities or infrastructure identified in that update. A very large footprint does not, by itself, describe the same immediate danger in every location. Government of the Northwest Territories
Fifteen major incidents, put into perspective
The list ranks this selected group by reported area. Dates show the August observation used, rather than implying that every perimeter was measured on 31 August. Each incident name links to its source.
1. **Thunder Bay 36** — 301,240 hectares Ontario, Canada. Report: 30 Aug 2026.
2. **ZF018-26** — 297,400 hectares Northwest Territories, Canada. Report: 23 Aug 2026.
3. **Big Grass** — 234,166 hectares Oregon / Idaho, USA. Report: 31 Aug 2026.
4. **Pear Lake** — 165,928 hectares British Columbia, Canada. Report: 30 Aug 2026.
5. **Rowe Creek Complex** — 151,323 hectares Oregon, USA. Report: 31 Aug 2026.
6. **ZF039-26** — 150,404 hectares Northwest Territories, Canada. Report: 15 Aug 2026.
7. **ZF017-26** — 128,911 hectares Northwest Territories, Canada. Report: 15 Aug 2026.
8. **Coleman Creek** — 124,992 hectares Oregon, USA. Report: 31 Aug 2026.
9. **FS027-26** — 88,658 hectares Northwest Territories, Canada. Report: 15 Aug 2026.
10. **Hay Creek Complex** — 81,055 hectares Oregon, USA. Report: 31 Aug 2026.
11. **Ainslie Creek** — 67,722 hectares British Columbia, Canada. Report: 24 Aug 2026.
12. **Sinlahekin** — 67,329 hectares Washington, USA. Report: 31 Aug 2026.
13. **Little Giant** — 66,000 hectares Washington, USA. Report: 31 Aug 2026.
14. **Tartar** — 63,951 hectares Idaho, USA. Report: 31 Aug 2026.
15. **Kaiser Canyon** — 55,965 hectares Washington, USA. Report: 31 Aug 2026.
Combined reported footprint: approximately 2,045,045 hectares — 20,450 square kilometres.
The equivalent square has sides of approximately 143 kilometres. This is an area comparison, not the shape or location of the fires.
The North American focus of this list reflects the incident-level reports verified for this review. Other major fires may be absent. In particular, regional totals covering many fires cannot be inserted as though they describe one incident.
Progress on containment still left a substantial job
Late-August reports showed different stages of response across the western United States. On 31 August, Montana’s Department of Environmental Quality listed Rowe Creek Complex at 92% containment, Coleman Creek at 99%, and Hay Creek Complex at 97%. Sinlahekin and Little Giant were reported at 40% and 49% respectively. Montana DEQ
Those figures describe very different operational situations beneath the same monthly headline.
Big Grass was reported at 578,637 acres and 94% containment on 31 August, with work continuing on remaining heat and suppression repair. That acreage converts to approximately 234,166 hectares. Daily Dispatch / KBOI-TV report
In British Columbia, a 30 August report put Pear Lake at 165,928 hectares. Cooler conditions were helping crews, although little rain had fallen on the fire. Castanet, reporting BC Wildfire Service information
The lesson for a monthly review is to track both scale and condition. A large existing perimeter, a quieter day and substantial work still ahead can all be true at once.
Beyond the largest footprints
August’s international story was not confined to the incidents in the list.
- Northern Russia: Copernicus reported substantial fire emissions in Yamal-Nenets, Krasnoyarsk and parts of Sakha. Yamal-Nenets recorded its highest daily emissions in the monitoring record during August.
- Europe: Belgium’s fire beginning on 14 August reached about 3,000 hectares, while significant activity continued in parts of southern Europe.
- Indonesia: Seasonal fires intensified in Kalimantan, with smoke affecting the wider region. Copernicus reported school closures and impacts reaching Singapore and Malaysia.
These observations come from the Copernicus Atmosphere Monitoring Service’s 21 August assessment. They describe conditions reported by that date, not final month-end totals.
The same assessment also cautioned against a universal record-breaking narrative: despite severe regional episodes, global year-to-date fire emissions were then at the low end of its 24-year dataset, influenced by reduced burning in tropical Africa.
What the hectares cannot tell us
An area comparison makes a large number visible. It cannot measure a family’s evacuation, the uncertainty around reopening a road, or the pressure on crews preparing for another difficult shift.
Nor does a ranking of footprints rank human consequences. A smaller fire close to homes can demand more urgent protective action than a much larger incident burning far from a community.
That is why this monthly series needs two lenses: the area affected and the people, infrastructure and response capacity exposed.
The PRAESI perspective: make response a continuous capability
For PRAESI, August reinforces the importance of connecting observation to practical response.
Information has to reach the people making decisions. Equipment has to be ready for the conditions in which it will operate. A response must be capable of continuing beyond the first intervention, with clear oversight and a realistic path to replenishment and recovery.
PRAESI is developing an integrated wildfire-response approach bringing together sensing, autonomous aerial suppression and operator oversight. The ambition is to support a more coordinated, repeatable response; performance must be established through testing and operational validation. This review does not attribute any of the reported fire responses to PRAESI.
Two million hectares should be more than a number we learn to recognise. It should strengthen the resolve to build, test and sustain better ways to respond.
Frequently asked questions
Did all 2.05 million hectares burn during August?
No. The figure adds cumulative areas reported during August for the selected incidents. Some of that land burned earlier. Calculating August-only growth would require comparable perimeter measurements at the beginning and end of the month.
Are these the world’s fifteen largest fires?
No. These are fifteen major North American incidents with August reports verified for this review, ordered by reported area. The international overview adds context without treating regional totals as individual fires.
Can this total be added to July’s?
No. Fires can appear in consecutive monthly reviews, so adding their cumulative footprints would count some land more than once. These selections also cannot establish a month-to-month growth rate.
Why use a square rather than another country?
A square makes the scale understandable without depending on familiarity with a country’s boundaries. The comparison follows directly from the total: 20,450 square kilometres is approximately 143 kilometres multiplied by 143 kilometres.
Sources and methodology
This retrospective covers fires active at some point during 1–31 August 2026, using the dated reports linked above. Research was completed on 12 September 2026. Figures are estimates and can change with remapping.
US acres were converted using 1 acre = 0.40468564224 hectares. The combined total was calculated before rounding individual entries. Reported fire areas do not imply uniform burn severity throughout each perimeter.
Reported complexes are counted once; their constituent fires are not added separately. Thunder Bay 36 is counted individually, without adding the encompassing Rinker Lake Complex. September perimeter updates are excluded from the calculation. The selection is neither a global burned-area estimate nor an exhaustive ranking.